What’s New

Review of the EC Site Specific Service for Wind Extremes

The CAN/CSA S37 Technical Committee set up the requirement for site specific calculation of the wind speed profile according to the National Building Code of Canada (Section 4.1.7). The NBCC procedures are based on Environment Canada research as published by Taylor and Lee (Simple Guidelines) paper which are also the basis for similar recommendations by other American Codes such as the ASCE 7 and TIA 222.

Unlike the other American codes, S37 does not explicitly specify the profile equations which the user can apply to his situation, leaving this task to be performed by Environment Canada or other Qualified Meteorologists. Environment Canada was tasked with providing the national wind map which is used for the Basic Wind determination and a service to provide the site-specific wind profile for any requested location on a cost-recovery basis.

The Basic Wind which is required by S37 is the hourly average wind at 10 m above ground. The map developed by EC uses the sustained wind (representing a 10 minute average in the last 10 minutes of the hour) as observed at several hundred stations across Canada. The S37 Annex E table E1 of winds for all communities with more than 10,000 population includes wind pressure values at 10 m height extracted from the EC map and adjusted for hourly average.

EC undertook to develop procedures that would provide estimates of the wind profile for engineering purposes at any height above ground, starting from the Taylor and Lee, and Walmsley and Taylor approach. which starts with the logarithmic profile at the base of a topographic feature and applying incremental changes due to terrain change and speed-up. EC then developed a single equation to encompass all effects. The reason for the logarithmic profile in the Simple Guidelines is that it represents the profile correctly up to 150 m above ground based solely on the roughness length, without the need for selecting appropriate exponents for a small class of terrain classes.

However, EC replaced the logarithmic wind profile with the power law profile in one part of the equation to satisfy the Canada Building Code procedure. The part of the equation dealing with the effect of a change in roughness on the slope retained the logarithmic correction term. This resulted in the equation generating physically impossible wind profiles when the slope roughness is much smoother than the roughness at approach to the hill.

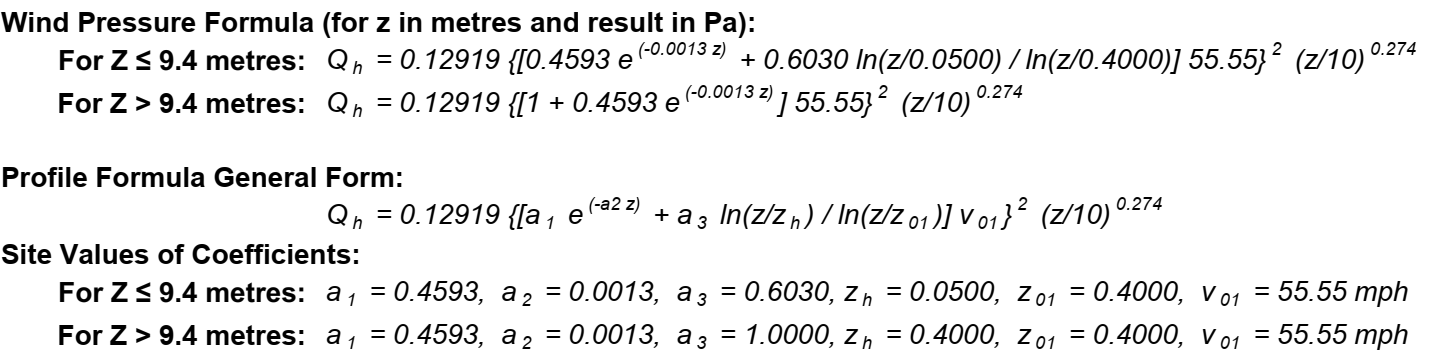
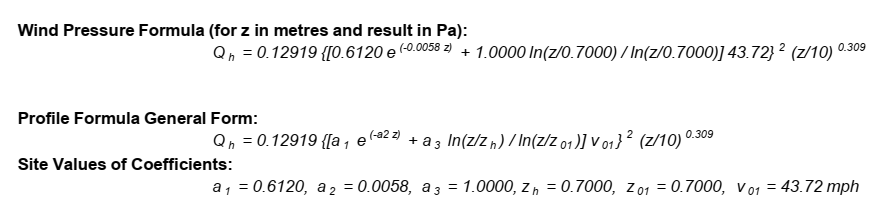
For example, the following equation and graph are from an EC report for Pink Mountain in BC using the version 1 equation.


The resulting wind profile shown in the figure below shows that the wind speed decreases with height right from the lowest level (the Qh curve). This happens because the logarithmic factor in the above equation decreases rapidly with height above ground, whereas the power law with the 0.1 exponent does not keep up with the decrease. In other words, retaining the log term within the brackets but decoupling it from the logarithmic profile produces a non-realistic wind profile.


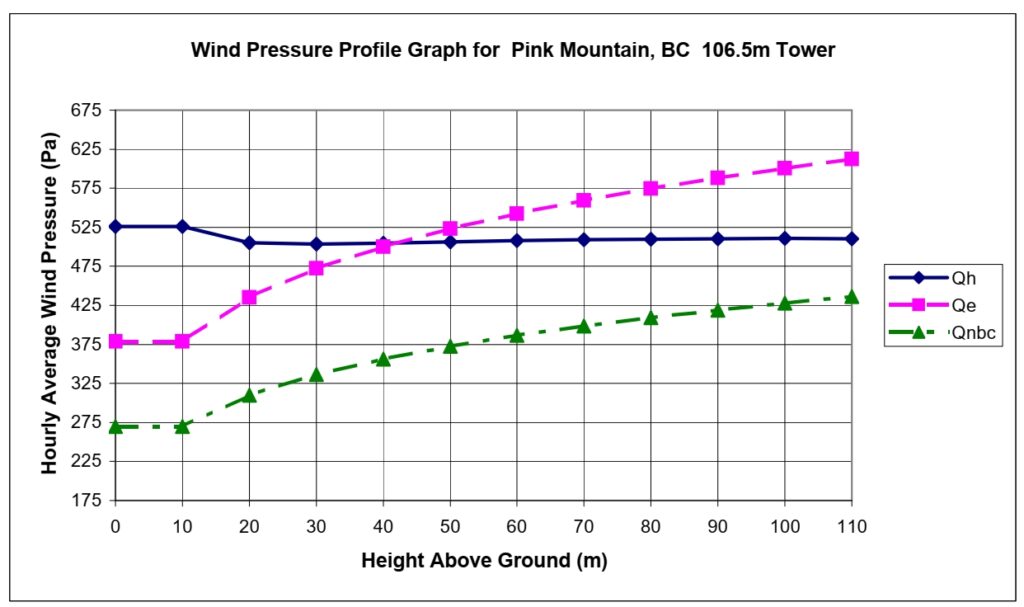
This is why EC created the Qe profile (shown in the figure), which follows the power law profile but is calibrated to produce the same total wind pressure over the height of the tower. This led to a severe under-prediction of the lowest levels on the tower and it also failed to produce a correct total pressure on the tower since it was calibrated against a false profile in the first place. As a result of a request from the S37 committee the Qe curves were dropped from the reports.

As a result of extensive discussion between the industry and practitioners such as Ice Inc. and Environment Canada researchers, EC decided to modify the equation for the profile. But instead of reinstating the logarithmic profile they decided to adopt the ASCE7 approach of several classes of terrain (B, C and D) and calibrated the exponents to match the ASCE7 decision on classification.

The equation was also modified to deal with the situation where the roughness length changes along the fetch up the slope, as seen in the Version 2.2 equation shown below. In this case, because the roughness length changes on the slope, the formula provides two equations, one which applies up to a height 56.5 m on this tower and one for the height above up to the top of the tower at 106.5 m.

Equations for version 2.2

Wind Pressure Formula (for z in metres and result in Pa):

For Z ≤ 56.5 metres:

Q h = 0.12919 {[0.0232 e (-0.0020 z) + 1.3072 ln(z/0.3000) / ln(z/0.0600)] 46.01} 2 (z/10) 0.205

For Z > 56.5 metres:

Q h = 0.12919 {[1 + 0.0232 e (-0.0020 z) ] 46.01} 2 (z/10) 0.205

Profile Formula General Form:

Q h = 0.12919 {[a 1 e (-a2 z) + a 3 ln(z/z h ) / ln(z/z 01 )] v 01 } 2 (z/10) 0.205

Site Values of Coefficients:

For Z ≤ 56.5 metres:

a 1 = 0.0232, a 2 = 0.0020, a 3 = 1.3072, z h = 0.3000, z 01 = 0.0600, v 01 = 46.01 mph

For Z > 56.5 metres:

a 1 = 0.0232, a 2 = 0.0020, a 3 = 1.0000, z h = 0.0600, z 01 = 0.0600, v 01 = 46.01 mph

Notice also that the exponent for the power law is the same in the two equations, even though the fetch roughness leading to the lower level profile is much higher than the fetch roughness representing the top layer of the tower, and one would expect a much larger exponent for the lower layer.

The reason the EC report set the exponents to be equal is that the wind speed predictions by the two equations would not match at the height of 56.5 metees. The atmosphere cannot maintain such a wind shear over a zero height interval.

The fix for this problem is shown in the more recent equations from EC reports. There is now only one equation, since the roughness length is not allowed to change on the slope.

Recent version 2.2 Equations

Wind Pressure Formula (for z in metres and result in Pa):

Q h = 0.12919 {[0.0686 e (-0.0036 z) + 1.0000 ln(z/0.0750) / ln(z/0.0750)] 54.57} 2 (z/10) 0.210

Profile Formula General Form:

Q h = 0.12919 {[a 1 e (-a2 z) + a 3 ln(z/z h ) / ln(z/z 01 )] v 01 } 2 (z/10) 0.210

Site Values of Coefficients:

a 1 = 0.0686, a 2 = 0.0036, a 3 = 1.0000, z h = 0.0750, z 01 = 0.0750, v 01 = 54.57 mph

This completes the transformation of the original equation which used continuous roughness length and allowed for a change in roughness on the slope, to an ASCE7 type of classification.

In performing this transformation, two additional errors have been made in the use of the original equation.

The first of these is that while ASCE7 recognizes that a minimum fetch is required to permit the use of say a B category instead of a C category, EC reports do not address the issue of length of fetch at all. So if there is a change in roughness from wooded to cleared at the summit, what distance of cleared fetch would be required to permit categorizing as a low roughness instead of a high roughness situation at the tower?

The second issue has to do with the choice of exponents which were made by EC. The ASCE7 presents two sets of exponents, one for the hourly average wind and another for the gust wind. When using the equations in ASCE7 one chooses the appropriate exponent according to whether the basic wind being input represents an hourly average wind or a 3 second gust.

The EC change over to the ASCE7 exponents chose the gust exponents, although the basic wind in S37 is meant to represent the hourly average wind and the wind speed tables provide the hourly average wind. Their reasoning in doing this is that the Gust Factor of 2 specified by S37-18 to deal with along wind turbulence is equivalent to 1.42 squared which happens to correspond to the ratio of gust to hourly average in the Durst Curve.

The factor of 2 is applied to the pressure profile for all heights above ground; however, the turbulence contribution to wind speed in the atmosphere actually decreases with height by as much as 20% or higher for tall towers which is why the gust exponents in ASCE7 are different from the hourly average exponents. The gust factor also depends on the roughness length (which is what causes the turbulence), and instead of contributing 42% at 10 meters the contribution can be as high 60 to 70%.

The correct approach to meet both of the requirements is for S37-18 to introduce a gust escalation factor which depends on the roughness at the site and decreases with height to correctly predict the gust wind at the higher levels on the tower. Such profiles can be generated by calculating the turbulence intensity term with height using empirical data or the Wieringa turbulence equation.

Summary

The EC single equation as modified in Version 2.2 and its current method of application do not meet the S37-18 requirement for a site specific assessment using local data and the NBCC recommended Simple Guidelines prescription for determining the speed profile.

Furthermore, the single equation approach as exemplified in Version 2.2 reports obscures the decisions made by the analyst about the terrain and topographic situation of the site and tower for the specific report being issued. The Engineer receiving the report and the Regulator reviewing the design are not provided the detail necessary to discuss and agree on the situation of the tower.

Essentially they are both asked to accept on faith that the profile being calculated by the equation according to the a1, a2 and a3 parameters as supplied in the report matches the actual situation. This is a dangerous proposition, as we have reviewed many reports such as the first one above which can lead to erroneous profiles or where the situation is completely misrepresented, such as ignoring the presence of a 200 m high ridge on which the tower is situated.

The practising design engineer and the regulator need a more complete report which allows them to spot problems, and request explanation for the choices.

How to calculate wind and ice loads on Communication Towers in Canada and the USA

The ASCE7 2022 and TIA 222-I have made significant changes recently to the treatment of topographic speedup in the case of a range of hills or ridges. Previous versions of the codes effectively ignored the speed up for non-isolated hills or ridges. The TIA 222-I has implemented the rolling terrain option to deal with this case, whereas the ASCE7 2022 has opted to drop the non-isolated hill designation so that all hills are treated in a similar fashion for the purpose of the speed up calculation.

These changes have implications for design of new towers, but also for evaluating required changes to loading of existing towers. The issues are addressed in the following paper: Wind Loads on Towers in USA.

The ECCC site specific calculation for the S37 code has also changed in the past two years, although the users of the service are not informed about such changes. Because the report provided by ECCC provides no clarity on how the site is characterized, the user is not in a position to determine whether the correct site is being identified and how it is treated. I have seen erroneous descriptions of sites in a number of reports which the user is not in a position to identify from the report provided.

I have prepared a paper which discusses this problem in detail which you can download at the following link. Wind Loads on Towers in Canada

Evaluation of the Checkwind Application Methods for Wind Profile Determination

What is Checkwind?

Checkwind (https://www.revolutio.com.au/software/checkwind/) is a web-based facility for performing the wind profile calculations required by the Building Codes in Australia, Europe, The US and Canada among others. It claims to be a site-specific response to the Code requirements for producing the wind profiles at a specified site.

I obtained a two week trial version of the Checkwind App in order to explore the facilities used by the program and supplied to the user by Checkwind, and to determine the congruence of the results to the code for which they were derived.

What does it do?

In addition to the calculation of the profile as per code, the app automates specification of three key input parameters required by the calculation, namely the basic wind speed for available MRI for the location, the exposure category, and the topographic parameters of shape and slope.

For the US codes the app retrieves the wind data from the ASCE 7 Hazard Tool available on the web. For the Canadian CSA it obtains the NBCC table data. For a number of other countries which publish their wind speed maps on-line the app obtains this information as well.

To derive the exposure category the app detects several different landscape categories which it classifies as open, water, urban on Google Earth satellite images of the area surrounding the site and determines the percentage of the area in each sector at the location of interest. Using this data the sector is classified as C or B or D for the US codes and as roughness length for the Canadian CSA S37 code.

For topography determination the app uses digital elevation data to evaluate transects of the terrain in order to calculate the isolated topographic feature’s crest and lowest point on the transect and then establish the distance at the half-height of the feature. The app seems to use some heuristics to establish the shape of the topographic feature as well as the height and length measurements.

The input required from the user is the type, shape and height of the structure and the location of the structure.

How well does it function?

The first observation I would make is that the Checkwind App is not providing a “Site-Specific” assessment of the situation as prescribed in the codes. It is using a mapped wind which is based on a limited number of observing sites and where the mapping process of necessity glosses over the local variations in weather systems and orography, and over-rides the variability of the wind speed statistics which is location dependent. The suggested approach in the codes for a site-specific assessment is to use local observations and perform the statistics over a long period of record to derive the return period winds. If you want to get the full benefit of site specific assessment you would need to obtain directional exposure and the corresponding directional extreme wind speed.

The app does provide the calculation which the specific code requires using automation of the input parameter determination. The author seems to acknowledge that this automated derivation is not foolproof as he suggests that the app must be used by a knowledgeable professional.

The following provides a summary of the main findings. For the full report click on the link below.

checkwind_review

The terrain categorization is adequate for the ASCE 7 and TIA 222 codes, since these require only 3 categories and are loosely defined. For the CSA S37 code which requires specification of the roughness length for the general area surrounding the site terminating at the base of the hill as well as the roughness on the slope of the topographic feature, Checkwind does allow for several zones for each sector, although the zones don’t seem to be tied to the distance from the crest to the bottom of the hill, with many of the sectors having only a single sector defined.

The topography determination obtains the elevation profile along sectors of 15 deg interval. It then seems to calculate the minima and maxima of elevation along the transect in order to establish the height and shape of the feature. This can be a complex procedure due to the highly irregular variations on the slopes of a hill or ridge.

For an example of a case where the hill parameters of height, shape, and off-slope distance are mischaracterized please see the full Checkwind report linked above. In this case the procedure located an escarpment 4 km downwind and used its parameters but set the Lint (off-crest distance) to -4km, which is seven times the half-height distance L. The program did not detect that this is more than 2 time L and hence calculated the speed up factor for the escarpment using a shape parameter of Ridge. This produced the largest speed up for the site.

The above error could only be detected by looking at the report which contains the topography calculation parameters and the results Qh.

Environment Canada Site Specific Equation Results are a Black Box to the User

The Environment Canada Wind Profile equation used in their site-specific recommendation calculates the wind pressure profile as a single equation containing 6 variables, including the wind speed at 10 m elevation from a map, the roughness length for the region as well as at the crest of the feature, and derived parameters which are related to the feature characteristics. A sample of the summary is shown below for Version 2.1, 2016 and Version 2.2, 2019.

Version 2.1 2016 Applied in March 2016

Version 2.2 2019 Applied in February, 2023


The version 2.1 equation was introduced in 2016 after extensive discussions between EC and industry which pointed out that the 0.1 power law for wind speed does not correctly represent actual winds for towers. The range of exponents adopted by EC to make the correction is from the ASCE 7 guideline, but the range is appropriate for 3 second gust winds, whereas the S37 requires an hourly average wind. Although ASCE 7 also supplies exponents appropriate for hourly averaged winds, the EC justification for their choice is that it is meant to provide gust information; however the gust effect factor in the code is meant to account for the gust component, so the recommendation should supply the hourly average wind.

In the example shown above for V 2.1 there is a change in exponent required because there is a change in roughness length on the fetch to the tower (going from 0.4 to 0.05 m). This necessitates two different equations to be used in the calculation. However, it can be seen that both equations in the example have the same exponent. This is the case for other profile calculations which I have seen, and is necessitated by the fact that if the different exponents were used for the two equations the profiles would not match up at the transition height.

In the latest reports based on V2.2 as shown in the second example there is a single equation used, meaning there is no change in roughness at the tower from the regional average. In many of the cases there actually is a change in roughness as there is for the V2.2 report shown above.

The tower in the second example is located on an escarpment, and is assumed to be surrounded by fully developed forest with roughness length of 0.7 m. In actuality it is located on an escarpment within 500 m from a Bay, so the roughness goes from 0.002 m over the water fetch of 3 km to 0.45 m averaged over the escarpment fetch. The correct description leads to a factor of 2 increase in the predicted wind pressure over the tower height, but the user of the report is not aware of the error and can make a totally erroneous design without being aware of it.

This example shows the need for the equation to deal with a change in roughness so as not to be constrained to an erroneous approximation. This can be easily done by keeping the original logarithmic profile for the wind in the equation which would avoid the mismatch between the assumed power law profile and the logarithmic term inside the brackets in the equation.

I have detected such issues in other cases as well, for example a tower located on a wooded 200 m high ridge is calculated as if there is no ridge at all.

The main problem with the EC recommendations report is the lack of detail in describing the situation to the user. Although it is possible to decipher the various parameters in most cases, as discussed in a previous blog on this topic, in this case the user would also have to go to Google Earth to be able to see the actual situation. In most cases, if the user were given the necessary description he could catch such errors.

The Site Specific report has to permit the user to see the assumptions underlying the calculation, with a location map to demonstrate that the correct situation is used in the report. Industry should press this issue with Environment Canada through the S37 Committee.

Major changes to the Topographic Factor calculation in Building Codes require the engineer to re-evaluate new and existing towers

The 2022 revision of ASCE 7 made a long-overdue change to the criteria for considering terrain speed-up of wind. The 2016 revision in Section 26 8 set out 5 criteria for determining whether an abrupt change in topography would be considered in calculating the speed-up factor Kzt.. Effectively these criteria meant that an engineer was not required to consider a speed-up factor for non-isolated hills.

This requirement for dealing only with isolated hills was not supported by experimental measurements. In fact, the Simple Guidelines on which the ASCE 7 speed-up equations in Section 26.8 were based provides the methodology for accounting for speed-up on non-isolated hills or ridges, so called undulating or rolling terrain. Physically, wind flowing over a shadowed hill downwind of a similar sized hill will experience a speed-up, but the magnitude of the speed-up will be reduced from that experienced by the upwind hill due to the loss of energy in the flow field.

By dropping the isolated hill criterion without changing the equations for the rolling hill condition, the 2022 revision of ASCE7 will over-state the effect in rolling hill situations. This is why the 2016 revision recommended that a valid site specific procedure be used in the more complex situation.

The ICE Inc. Site Specific Procedure implemented in 2012 uses the original Simple Guideline procedures to determine topographic speed-up, thus avoiding the error of ignoring speed up on downwind hills. An Australian Field Study in the Belmont Hills of New Zealand published in 2015 compared the prediction of the speed-up prescription as specified by 7 Wind loading Standards which showed that while most were able to show speed-up on the first hill in the range of 9 hills, none of the codes, including the ASCE 7, was able to show speedup for subsequent hills. ICE presented a paper at the 2022 IASS Work Group meeting in Toronto, showing that the ICE implementation of the Simple Guidelines is able to reproduce the observed speed-up values over the entire range of hills.

This fall the ANSI/TIA 222 has announced that Revision I of the Standard has been approved. Among the many changes in this revision, the speed-up equations for topography were modified in accord with the Simple Guideline recommendations, including the rolling terrain prescription. ICE has tested the new TIA equations against the Guidelines and the ICE implementation of the Guidelines for several simple cases and finds good agreement. One of the situations dealt with by TIA as a separate category is the flat-top hill. The ICE procedures do not require this because it can be dealt with by using the escarpment prescription.

There are more complicated cases where the ASCE7 and TIA 222 are not able to provide adequate guidance. For these cases they recommend that a site specific study be carried out. For example, the special wind region designation applies to the situation where mountain ranges or other flow modification obstacles make the map wind values unrepresentative for a specific location. In this case the study includes using local wind information of sufficient duration and statistical methods to establish the return period wind or gust. After performing thousands of extreme wind derivations it has become clear that the wind map can be misleading even in areas which are not in the designated special wind regions.

The first step in evaluating the appropriate speedup profile is the characterization of the terrain roughness. The codes still retain the 3 way classification of the terrain, which sets lower bounds on the length of fetch in order to correctly categorize the terrain. In most of the cases the categorization of the terrain exposure into one of B, C, or D results in unrealistic wind profiles with height. This error is then compounded in the case where topographic speedup is experienced. For example if the tower is located on a wooded hill with the surrounding terrain being rural and fronting on a lake shore, depending on the fetches it may be impossible to assign a category which captures the wind behaviour adequately.

The problem stems from the fact that the lowest level of atmosphere is modified by interaction of wind flow with the underlying surface. When there is a large change in the surface characteristics the lowest level readjusts to the new conditions, whereas the higher levels retain the original characteristics. This means that the wind profile cannot be described by a single power law profile.

As an example, if the flow originates over a large body of water (river, lake or coastline), once it passes over the land it is modified at the lowest level, producing significant slowdown depending on the new exposure conditions, and the depth of the modified layer grows with inland distance. In the modified layer a different profile is required but this cannot be extended to the higher levels without misrepresenting the wind speeds. The net result is that a tall tower is experiencing speeds which are different from the simple power law characterization.

In the ICE site specific procedures the exposure conditions are described by the roughness length on a continuous scale, and abrupt changes in land cover or land use are explicitly taken into account to adjust the profile. This procedure is more computationally intensive and requires the use of a computer program and more detailed characterization of the surface conditions with distance from the tower site.

The codes still retain the requirement that the extreme wind be assumed to approach the topographic feature from any wind direction. Since the speed-up effect depends on obstacle type and terrain roughness which differ for different wind direction, this requirement will over-estimate the speed-up that can actually occur. ICE has developed a more detailed directional procedure which characterizes the basic wind at the airport by wind direction sector and characterizes the topographic feature and changes in exposure by direction to provide a fully documented realistic speed-up for each of the sectors to permit the selection of the overall maximum wind speed.

Hills and ridges also affect the ice accumulation on a tower in a freezing rain or in-cloud event both due to wind change with height and temperature change with height, especially for tall towers. In our site specific procedures we explicitly account for these changes in producing estimates of glaze and rime icing accumulations for specified return period as a profile with height.

Directional Extreme Wind

Building Codes such as ASCE 7, TIA-222, S37, and the Euro Codes stipulate that, in  the absence of site specific studies, extreme wind assessment must assume that the extreme wind can occur from any direction. This assumption can be a severe over-estimate of the the actual wind loading on the structure when the site is situated in complex terrain or the airport observation site has non-standard exposure, as is often the case.

ICE Inc has produced site specific assessments for thousands of sites over the past 12 years and noted many cases where the airport observations are affected by directional exposure differences and even topographic enhancements. Also quite often there is a large directional variation in extreme winds making the interaction with topographic features highly specific to the location of the site.

In some of these cases special studies were required to determine the applicability of the code prescription for extreme wind. As a result of these studies ICE has developed the methodology for providing directional extreme winds using hourly observations segregated into 8 sectors followed by terrain and topographic corrections specific to each of the sectors. This provides extreme wind profiles for each sector for any specified recurrence interval which allows for comparison of wind pressures over the height of the structure for all sectors to ensure that the worst case design wind is applied.

ICE now offers the current standard wind profile assessment for simple situations and the new directional assessment for more complex meteorological and or topographic situations. When providing a quote for a site-specific report ICE can make a recommendation on the necessity for a directional assessment.


Ice Shedding from tall Broadcast Towers and Communication Towers on Elevated Terrain

Communication towers on elevated terrain and tall broadcast towers can experience rime ice accumulations which are greater than the glaze ice accumulations. Building Codes such as S37 in Canada and codes in other cold weather locations do not include consideration of rime icing.

Aside from the impact of rime accumulation on tower wind loading, there is the additional hazard to people at ground level well removed from the tower site due to the ice shedding at the end of an event which can lead to serious injury in extreme cases.

To establish the potential hazard zone requires knowledge of the maximum accumulation for the event, which determines the maximum size and weight of the ice fragments, and the profile of wind speed at the time of the shedding. This data is used to determine the terminal velocity of ice fragments released at different heights on the tower, and hence the distance of travel of the ice fragment and the Kinetic Energy of the fragment at ground level.

Since the ICE Inc procedure calculates the icing and wind parameters for each event, the calculation can be used to map out the locations of greatest impact by direction from the tower, and establish hazard zones surrounding the tower.

ASCE 7 2022 Changes the Isolated Topographic Feature Criterion for Wind Speed-UP

The 2022 version of ASCE 7 Guidance has changed Section 26.8 conditions for calculating the topographic factor Kzt by dropping the requirement that the topographic feature must be deemed an isolated hill or ridge for the speed up to occur. In effect this means that any hill or ridge must now include the calculation of a speed up factor.

This change is long overdue, since there is no evidence that the speed-up does not occur for the second and subsequent hills in a range of hills. In fact the original formulation of the wind speed up had a provision for this condition (rolling or undulating hills). The ICE site specific procedure developed in 2012 includes the rolling terrain specification in all site specific assessments which we carry out.

As discussed in our previous post (Wind Speed-Up Formulation Testing), ICE presented an analysis of the recent tests of the speed-up equation by Australian researchers which shows that the ICE site specific procedure predicts speed-up values which agree with the described wind tunnel and numerical modeling results.

The discussion paper referenced in the previous post shows that the speed up for the second and subsequent hills in rolling terrain does require modified values for the γ parameter which are about 25% less than the values for an isolated hill, which results in smaller speed-up in the rolling terrain case. In effect the change to Kzt in the 2022 version will result in over-statement of the speed-up compared to experimental data.

The effect in practice of the new 2022 version of ASCE 7 and derivative codes is that existing towers designed with previous versions may be under-designed according to the new code. On the other hand, towers in rolling terrain situations designed with the 2022 code will face up to 30% excessive wind pressure determinations.

Tower designers and owners in the rolling terrain situation should re-evaluate the design basis, which could be done with a proper site specific assessment.


ICE Inc. presented at the IASS WG4 Meeting in Toronto, Sept 11-15, 2022

The Technical Expert Group on Masts and Towers (WG4) of the International Association for Shell and Slender Structures held its biennial meeting in Toronto, Canada on September 11 to 15. ICE presented 2 papers to the group dealing with current issues of interest to the engineering community.

“Wind Extremes in Changing Climate” presented our new service which provides site specific extreme wind extremes in a future climate based on Environment Canada regional model runs for the present and future out to the end of the century. This uses the change in 50 year return winds for a given site based on the current 30 year run compared to a future run for 2070-2100. This relative change is applied to the standard site specific derivation based on the past 40 to 50 year airport data to project the extreme wind change from the current to the future period.

The results of applying this method to two sites separated by 400 km in Ontario show a 13% increase at one site and a 4% decrease at the other site, showing the potential error in applying a provincial or even regional average change as would be available from some of the model output maps.

The discussion paper is available at:

https://www.ice-inc.co/wp-content/uploads/2022/10/Wind-Extremes-in-Changing-Climate-IASS.pdf

The second discussion paper “Wind Speed-Up Formulation Testing” presented the results of recent measurements and wind tunnel simulations carried out by Australian Researchers for the case of Belmont Hills in New Zealand.

The objective of the research was to determine how well the various building codes dealt with the wind speed-up caused by a range of hills also called rolling or undulating terrain. The observations as well as the tunnel testing and numerical modeling show that none of the codes tested, which include the Australian, ASCE 7, NBCC S37, European,  Korean or Japanese codes, were able to reproduce the observed speed-up by the hills.

Our paper shows that all of these codes assume that the speed-up formulation can only be applied for isolated hills which means that they do not show any speed-up for the second and subsequent hills, whereas the data shows that each of the hills causes a speed-up almost independently of other hills in the range.

The ICE Inc. site specific formulation developed in 2012 and applied in all of our site-specific assessments starts from the original “Simple Guidelines” by Walmsley,  Taylor and Lee which included the treatment for a range of hills. Applying our procedures to the Belmont Hills topography shows good agreement with the wind tunnel data.

It is interesting to note that the ASCE 7 2022 version has removed the restriction to isolated hills so that every hill or ridge will need to be evaluated for speed-up. The new ASCE 7 approach will lead to a 30% or greater over-statement of the speed-up effect on subsequent hills in the range.

The discussion paper is available at:

https://www.ice-inc.co/wp-content/uploads/2022/10/Wind-Speed-Up-Formulation-Testing-IASS.pdf

Join ICE Inc. at the STAC 2022 Virtual Conference on March 28-30, 2022

ICE Inc. (International Climatic Evaluations) principals will be presenting a paper entitled “Prediction of Design Wind and Ice in a Changing Climate” in the session

S14. Climate Change and the Prediction of Design Wind and Ice Loads, on March 30 at 10:00 am.

An overview of the products and services which we offer, with links to more detailed discussions of the services and related topics is available online at https://www.ice-inc.co/wp-content/uploads/2020/02/Products and Services at a Glance.pdf.

We will be available to discuss any questions you may have about the services during the conference days. We are also available at any time from this site’s contact page.