The new Annex T to the CSA S37-18 Tower Code sets out the requirement on the engineer to take into account climate change in deriving wind loads and icing potential, and contains a discussion of results from the Canadian Climate Models developed by Environment Canada including some relevant results to date. Some of the findings from these models show a high variability across Canada in the values for wind speed extremes, and in particular the statistics of extremes (Dae Il Jeong et al, Atmosphere 2019, 10, 497). This leads to significant variability in the impact for different regions in Canada and at the sub-regional scale.
Model results for current scenarios have been summarized on the EC Climate website and in journals, but again do not assist the engineer in obtaining a specific value which he can use in the analysis and design of a tower for a given site. The models produce large volumes of gridded output from model runs for several scenarios of emission, but do not provide the means for the engineer to determine the likely impact for a specific tower site.
ICE Inc has obtained model results from the Climate runs at high resolution and developed analysis tools to extract data for a specific location to produce a 30 year monthly maximum series of wind speed at the 10 m level to permit analyzing the return level wind for the site. By doing this for a current scenario and a future scenario it is then possible to provide a measure of the relative change to be expected for the site due to climate changes. Applying the relative change to the site specific wind results based on historical data then produces a 50 year return level wind which reproduces the trend that the models are showing for the future scenario.
At present the future scenario being used is RCP8.5, which has business as usual emissions, in other words the current increase in GHG will continue into the 2050 time frame, and produce the maximum changes due to climate. As the likely scenario is modified in time and takes into account actual changes in emissions and better projection of the emissions, and as EC runs the models for alternative likely scenarios, the analysis can be recreated for the site to reflect the expected changes at that point. It would be particularly useful if EC created multiple runs with this and other models, as this would produce a higher confidence in the predictions.
This approach allows us to provide the same site specific report format as currently provided with the added results of applying the climate change variation to the historical data. As an example, Table 1 shows the data for Ottawa Airport and a nearby tower site located in an agricultural area, with no topographic influences. The results of 50 and 10 year return level evaluation of the climate data for a 30 year period starting in 2006 are compared to RCP8.5 evaluation in the 2070 time frame, and show a 2.9 m/s increase in the 10 m level wind for 50 year return and a 2 m/s increase for the 10 year return wind. These represent approximately a 12% increase in the wind speed over the current climate.
The last two columns in the table for this site show the effect of applying this relative increase to the historically measured winds at Ottawa and the predicted return level winds using the same statistical approach. When compared on a wind pressure basis this represents a 28% increase in pressure for the 10 m level on the tower. Note that in this approach all of the other impacts of terrain, topography, tower height, etc. are automatically included in the modified value, so the engineer can use the modified value and the modified 95% confidence interval in his design in the same way that he currently uses the expected wind.
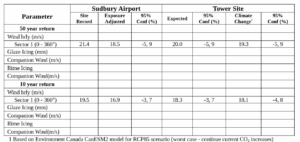
For other sites the relative change will clearly be different and may amount to a decrease in the 10 m wind, which is why the analysis from model data is done for each site. See Table 2 for a site near Sudbury as an example of the case where a decrease in extreme wind is expected.
Table 1 Site near Ottawa
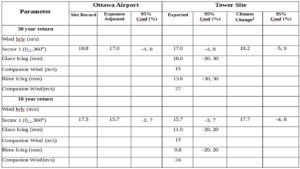
1 Based on Environment Canada CanESM2 model for RCP85 scenario (worst case – continue current CO2 increases)
Table 2 Site near Sudbury